
Everyday use · 6 min read
Benefits and measures
Recording a benefit case, setting baselines and targets, handling lower-is-better measures, and evidencing verification.
Two different claims
A benefit case says what the improvement is worth. Measures say whether it worked. They are separate on purpose, and an improvement can carry either, both or neither — though it needs at least one of them before it can be verified.
The benefit case
Four fields plus a narrative, all on the raise and edit form.
| Field | What it means |
|---|---|
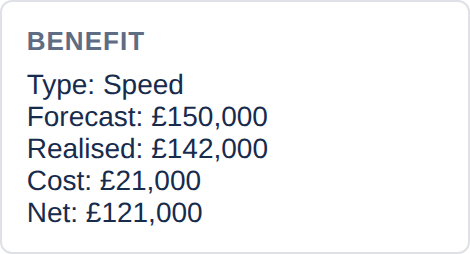
| Benefit type | Cost reduction, risk reduction, quality, customer experience, compliance, speed or capacity. Reportable on the dashboard, so pick the primary one rather than the most flattering. |
| Forecast benefit | What you expect it to be worth, annualised, in the project's currency. This is a prediction and it is reported as one. |
| Realised benefit | What it turned out to be worth. Only counted once the record reaches Verified or Closed — see below. |
| Cost estimate | The one-off cost of implementing it. Feeds return on cost, and the value component of the composite score. |
| Benefit narrative | Where the number comes from, or the case in words when there is no sensible number. If your project requires a benefit case, either this or a forecast figure satisfies it. |
Why realised benefit only counts after verification
This is the single most important rule in the app, and the reason the dashboard figures are worth showing to somebody sceptical.
A realised benefit typed onto an improvement that is still In progress is a hope. So the roll-up ignores it. Only records at Verified or Closed contribute to realised benefit, realisation rate and return on cost.
And a record cannot reach Verified without having been Implemented, and cannot be verified at all without either a realised figure or a measure. The lifecycle, not the honour system, is what makes the number defensible.
Realisation rate compares like with like. It is realised benefit divided by the forecast of the verified and closed records only — not by the forecast of the whole register. Adding an ambitious forecast to a brand-new improvement cannot move it.
Measures
A measure is a KPI with a baseline, a target and an actual. Add as many as the improvement genuinely moves — two or three is usually plenty, and one is far better than none.

Direction matters
Each measure carries a direction. MTTR, incident volume, change lead time and backlog age all improve as they fall; first-contact resolution and satisfaction improve as they rise. Set it correctly or your progress figure will read backwards.
How progress is worked out
Progress is how far the actual has travelled from the baseline towards the target, clamped between 0% and 100%. Taking the example above — baseline 26 hours, target 4, actual 6:
(6 − 26) ÷ (4 − 26) = −20 ÷ −22 = 0.91 → 91%
A measure needs all three numbers before it counts. The measure progress figure on the record is the mean across every fully populated measure; ones still missing an actual are left out rather than counted as zero.
Getting to verified
When you move a record to Verified, the app checks that you have recorded either a realised benefit figure or at least one measure. If you have neither you will see:
Record a realised benefit or at least one KPI before verifying an improvement
This gate is always on — it is not project policy and cannot be switched off. Verification is the moment the register starts making a claim about outcomes, so it asks for something to back it up.
Benefit reviews
The review cadence on a record sets how often its benefit should be revisited — 90 days by default. When the review date passes, the improvement is flagged Due for review — on the record, in the attention banner and on the dashboard.
Clear the field entirely for improvements that genuinely need no periodic review. Leaving it blank means none; it does not quietly fall back to the project default.
How this rolls up
| Dashboard figure | How it is calculated |
|---|---|
| Realised benefit | Sum of realised values across verified and closed records. |
| Forecast | Sum of forecast values across every record that has one. |
| Realisation rate | Realised ÷ forecast of the verified and closed records. Can exceed 100% when improvements beat their forecast. |
| Return on cost | Realised benefit ÷ total cost estimate across the register. Note the asymmetry: the numerator counts only completed work, the denominator counts what you have committed to. Early in a programme this reads low, and honestly so. |
| Net benefit | Realised benefit less total cost. |
See Reading the dashboard for where each of these appears.