
Everyday use · 5 min read
Prioritising with RICE and the composite score
How both scores are calculated, what to put in each field, and why an unscored improvement stays unscored.
Two scores, different jobs
Every improvement carries two numbers. They answer different questions, and it is worth knowing which one you are looking at.
- RICE is the familiar product-management formula. It needs four inputs, and if any is missing you get no score at all.
- Composite is a 0–100 ranking that works from what the record already holds — its benefit case, its effort size and its priority. It always produces a number, which is why it is the one shown in the register.
RICE
The formula is the standard one:
RICE = (reach × impact × confidence) ÷ effort in person-days
| Input | What to enter |
|---|---|
| Reach | How many users, services or incidents are touched per period. Pick a period and stay consistent across the register — the absolute number matters less than comparability. |
| Impact | 1 to 5. How much difference it makes to each of them. |
| Confidence | 0 to 1. How sure you are of the first two. 0.8 is a well-evidenced case; 0.5 is a reasonable guess. |
| Effort | A t-shirt size, converted to person-days: XS = 1, S = 3, M = 8, L = 20, XL = 50. |
Worked example. Reach 1,200, impact 5, confidence 0.9, effort M (8 days): (1200 × 5 × 0.9) ÷ 8 = 675.
Leave the fields blank if you have not assessed them. A missing input gives no RICE score rather than a zero. This is deliberate: an improvement nobody has sized should not sink to the bottom of a sorted list alongside work genuinely assessed as low value. The register shows a dash.
The composite score
Three components, each normalised to 0–1, then combined using the weights your administrator sets, and multiplied by 100.
Value — from the benefit case
Forecast benefit divided by cost estimate, capped so that a return of three times or better scores full marks. A forecast with no cost recorded is treated as a strong return; neither figure scores zero.
Effort — from the t-shirt size
| Size | Person-days | Component |
|---|---|---|
| XS | 1 | 1.00 |
| S | 3 | 0.96 |
| M | 8 | 0.86 |
| L | 20 | 0.61 |
| XL | 50 | 0.00 |
| Not sized | — | 0.50 |
Risk — from the priority
This is the component people misread, so it is worth being blunt: the third weight is driven by the record's priority field. There is no separate risk input.
| Priority | Component |
|---|---|
| Critical | 1.00 |
| High | 0.67 |
| Medium | 0.33 |
| Low | 0.00 |
Putting it together
With the default weights — value 0.5, effort 0.3, risk 0.2 — an improvement forecasting £240,000 against £18,000 of cost, sized M, at Critical priority:
value 1.00 × 0.5 = 0.500
effort 0.86 × 0.3 = 0.257
risk 1.00 × 0.2 = 0.200
total 0.957 → 95.71
Each weight is a number from 0 to 1, and at least one must be above zero. Because the weighted sum is divided by their total, they do not have to add up to 1 — setting all three to 0.5 simply weighs them equally. See Project settings to change them.
Using the scores
Both appear on the record, and the composite score is a column in the register. Sorting by it is the quickest way to build an agenda for a prioritisation meeting.
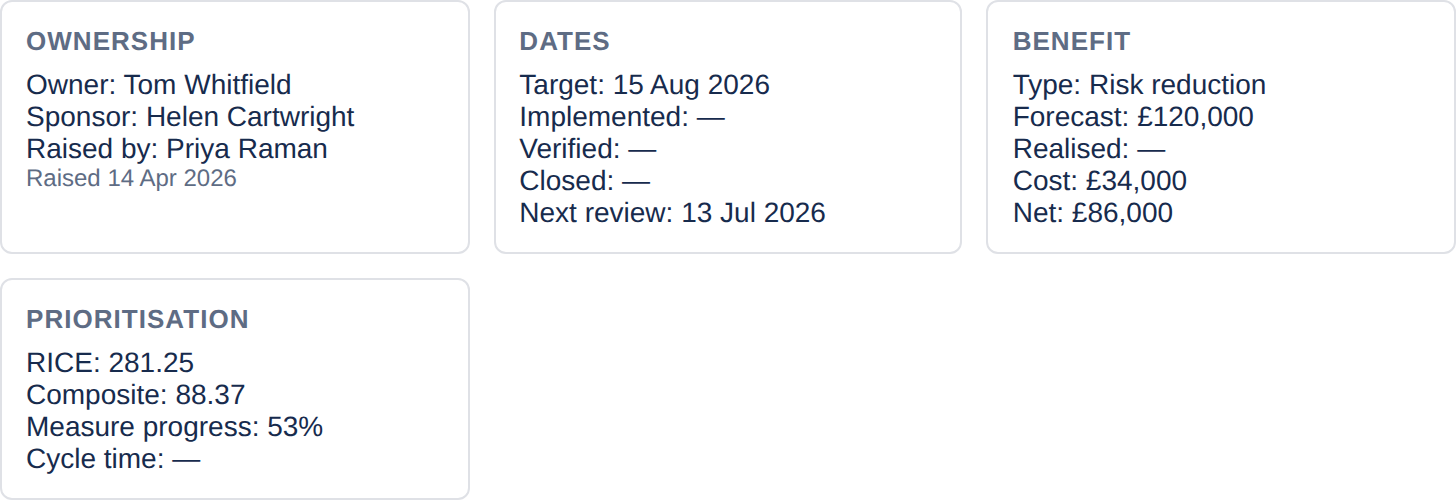
The composite score is a ranking aid, not a decision. It knows nothing about sequencing, dependencies, or the fact that the compliance item is due before the audit. Use it to order the conversation, not to end it.
A sensible working practice
- Fill in priority and effort on every record — between them they drive half the composite score, and both are quick judgements.
- Add the benefit case at triage, when you are deciding whether to approve it anyway.
- Reserve full RICE for the shortlist. Four inputs on eighty records is a cataloguing exercise; four inputs on the eight you are choosing between is a decision.